Taking a break from Brexit related posts, here is a purely Costa del Sol property related subject: by how much do property prices per metre squared vary in a certain location? We all expect euros/m2 to vary between Marbella and San Pedro for example, but how about within San Pedro itself? This question came up when we compared euros/m2 paid by clients along the coast and we realised that some areas had massive variations, and others very close to 0 differences. So check your area of interest below to see if it might be possible to get a better deal for the same square metreage.
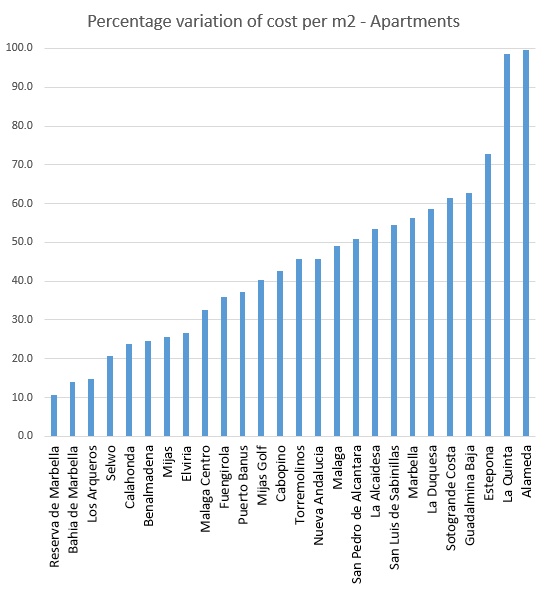
Let's look at an example with a graph. The image and datatable below show values for apartment prices per m2. Around the 50% mark we find:
Location: San Pedro de Alcantara
Minimum price pre m2: 1536 euros
Range: 50.7% - i.e. you might find properties with anywhere between 1,536 euros/m2 and 50% higher (3,118 euros/m2)
This might present the property buyer with some opportunities. But first the data:
| Location |
Minimum |
Maximum |
Difference |
% variation |
| Reserva de Marbella |
1639 |
1837 |
198 |
10.8 |
| Bahia de Marbella |
3318 |
3854 |
536 |
13.9 |
| Los Arqueros |
2584 |
3030 |
446 |
14.7 |
| Selwo |
1517 |
1912 |
394 |
20.6 |
| Calahonda |
1816 |
2386 |
570 |
23.9 |
| Benalmadena |
1870 |
2482 |
612 |
24.7 |
| Mijas |
1458 |
1962 |
504 |
25.7 |
| Elviria |
2183 |
2974 |
791 |
26.6 |
| Malaga Centro |
2212 |
3280 |
1068 |
32.6 |
| Fuengirola |
2255 |
3524 |
1269 |
36.0 |
| Puerto Banus |
4367 |
6968 |
2601 |
37.3 |
| Mijas Golf |
1804 |
3022 |
1218 |
40.3 |
| Cabopino |
2435 |
4240 |
1805 |
42.6 |
| Torremolinos |
1980 |
3639 |
1660 |
45.6 |
| Nueva Andalucia |
2601 |
4793 |
2192 |
45.7 |
| Malaga |
1504 |
2958 |
1455 |
49.2 |
| San Pedro de Alcantara |
1536 |
3118 |
1582 |
50.7 |
| La Alcaidesa |
1735 |
3725 |
1990 |
53.4 |
| San Luis de Sabinillas |
856 |
1885 |
1029 |
54.6 |
| Marbella |
3299 |
7532 |
4233 |
56.2 |
| La Duquesa |
1629 |
3935 |
2306 |
58.6 |
| Sotogrande Costa |
1377 |
3565 |
2188 |
61.4 |
| Guadalmina Baja |
1564 |
4209 |
2645 |
62.8 |
| Estepona |
1300 |
4772 |
3472 |
72.8 |
| La Quinta |
1791 |
126559 |
124768 |
98.6 |
| Alameda |
2035 |
617284 |
615249 |
99.7 |
As you can see, for areas that are relatively small or from a handful of developers, such as Bahia de Marbella, Los Arqueros etc, the percentage variation is small, i.e. any apartment will cost as any other, the main variable being the built area - prices per square metre are very similar. What was unexpected, at least for us, is the fact that large diverse areas like Calahonda or Benalmadena also have narrow price/m2 ranges. This indicates to us that there is high competition, sellers cannot get away with setting a higher-than-average price, so as a buyer you might expect to get a "fairer" price for your property.
In contrast, equally surprisingly, we have compact areas like Sabinillas or Sotogrande with upto 60+% difference in cost per m2. As a buyer in these areas, you might be advised to shop around because it is quite possible to find a very similar property upto 60% cheaper, in the extreme cases.
(Notice that I left out of the discussion the lower and higher data points because they seem like ouliers)
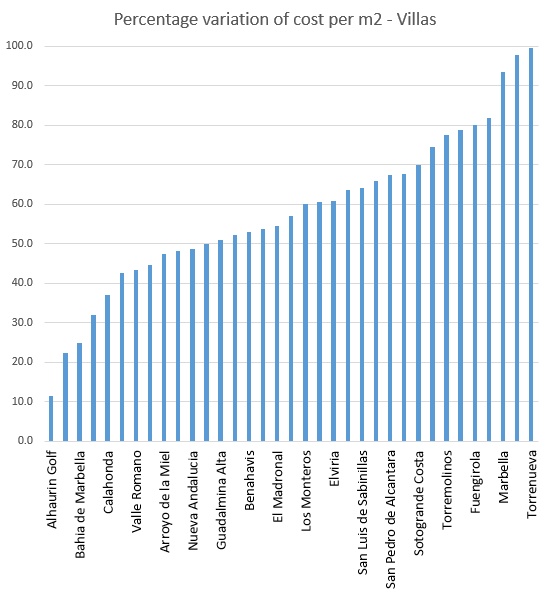
For villas the data is as follows:
| Location |
Minimum |
Maximum |
Difference |
% variation |
| Alhaurin Golf |
2230 |
2517 |
287 |
11.4 |
| La Alcaidesa |
2056 |
2648 |
592 |
22.4 |
| Bahia de Marbella |
3902 |
5200 |
1298 |
25.0 |
| La Linea |
1221 |
1798 |
577 |
32.1 |
| Calahonda |
2100 |
3333 |
1234 |
37.0 |
| Casares Playa |
1714 |
2987 |
1273 |
42.6 |
| Valle Romano |
1387 |
2453 |
1066 |
43.4 |
| Bel Air |
1775 |
3213 |
1437 |
44.7 |
| Arroyo de la Miel |
1777 |
3375 |
1598 |
47.3 |
| Cancelada |
2797 |
5391 |
2594 |
48.1 |
| Nueva Andalucia |
3200 |
6240 |
3040 |
48.7 |
| La Duquesa |
1471 |
2937 |
1467 |
49.9 |
| Guadalmina Alta |
1750 |
3568 |
1818 |
50.9 |
| Los Arqueros |
2392 |
5018 |
2626 |
52.3 |
| Benahavis |
2176 |
4639 |
2462 |
53.1 |
| Cabopino |
2483 |
5384 |
2901 |
53.9 |
| El Madronal |
2872 |
6333 |
3461 |
54.6 |
| Benalmadena |
1622 |
3769 |
2147 |
57.0 |
| Los Monteros |
4018 |
10040 |
6022 |
60.0 |
| Selwo |
1410 |
3583 |
2173 |
60.6 |
| Elviria |
2205 |
5638 |
3433 |
60.9 |
| Monda |
1000 |
2750 |
1750 |
63.6 |
| San Luis de Sabinillas |
934 |
2600 |
1666 |
64.1 |
| New Golden Mile |
1991 |
5827 |
3835 |
65.8 |
| San Pedro de Alcantara |
2230 |
6858 |
4628 |
67.5 |
| Puerto Banus |
3542 |
10972 |
7431 |
67.7 |
| Sotogrande Costa |
1495 |
4967 |
3472 |
69.9 |
| El Paraiso |
3037 |
11964 |
8926 |
74.6 |
| Torremolinos |
825 |
3661 |
2836 |
77.5 |
| Estepona |
1582 |
7515 |
5934 |
79.0 |
| Fuengirola |
1197 |
5993 |
4797 |
80.0 |
| La Zagaleta |
3277 |
18125 |
14848 |
81.9 |
| Marbella |
1700 |
25848 |
24148 |
93.4 |
| Malaga |
1729 |
82529 |
80800 |
97.9 |
| Torrenueva |
2244 |
476958 |
474715 |
99.5 |
Again, if you are looking for a villa in El Paraiso, or Elviria then it might be worth your while to compare prices per m2 to ensure you are getting a fair deal in the market.
I hope you find the data as thrilling as I do :-) We have many more property statistics on our website, so if you are interested either click the links on the right or send me a PM here, I can forward you the Excel data or give you some more hints depending on your Costa del Sol area of interest.
Till next time, thanks for reading.