Spanish property market continues rise at slower pace - latest data
Saturday, April 6, 2019
Property prices in the whole of Spain have continued to rise, but at a much slower pace.
Property sale data for full year 2018 and January 2019 have been published by INE, the Spanish statistics institute. Firstly, the comparison of 4th quarter 2018 to 4th quarter 2017, where the increase in prices on average was 6.6%:
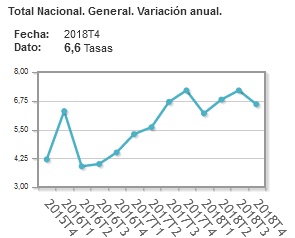
Broken down by type, newly constructed properties have risen by 8.0% in price and resale properties by 6.4% compared to 4th quarter of 2017. We see that the prices are still rising, since the number is a positive one, however at a slightly slower pace compared to earlier quarters of 2018.
The slower rate of price increase is more evident when compared to the previous quarter, i.e. 3rd Q of 2018, where we see the value barely in positive territory, at 0.4%:
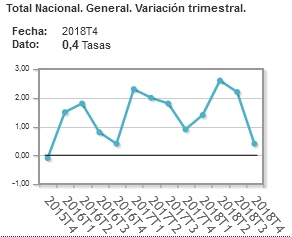
What does that tell us? As you can see in the graph above, there is a strong seasonal effect: every 4th quarter (marked with T4) sees a drop to the lowest rate of price increase (if still positive as in this case) for the year. So this latest drop is not in itself meaningful. We expect a spike up again for the first trimester of 2019 – if this materialises, then we know that the 4th quarter 2018 deceleration was once again the seasonal effect.
The table below summarises the data:
|
|
|
Quarterly variation
|
Annual variation
|
|
Average index
|
|
0.4
|
6.6
|
|
New construction
|
|
1.2
|
8
|
|
Resale properties
|
|
0.3
|
6.4
|
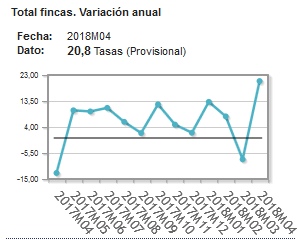
For a peek into the possible values of the first trimester 2019 we can look at the just released data for number of properties sold in January 2019:
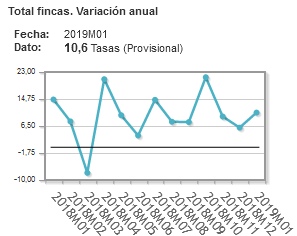
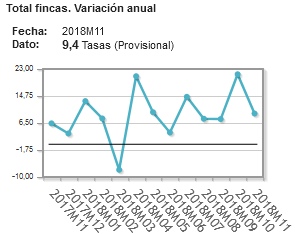
Compared to the number of properties sold in January 2018, we see that we now have 10.6% more properties sold. And from the graph above we can see that the rate is picking up compared to the 6.5 of the month prior.
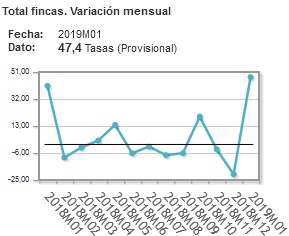
The total purchase operations for January 2019 were 198,298, a whopping 47.4% increase compared to January 2018! A data point that bodes well for the expected “spike” mentioned earlier.
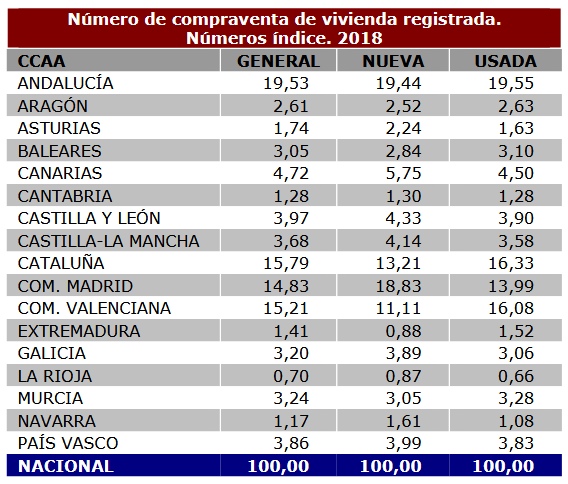
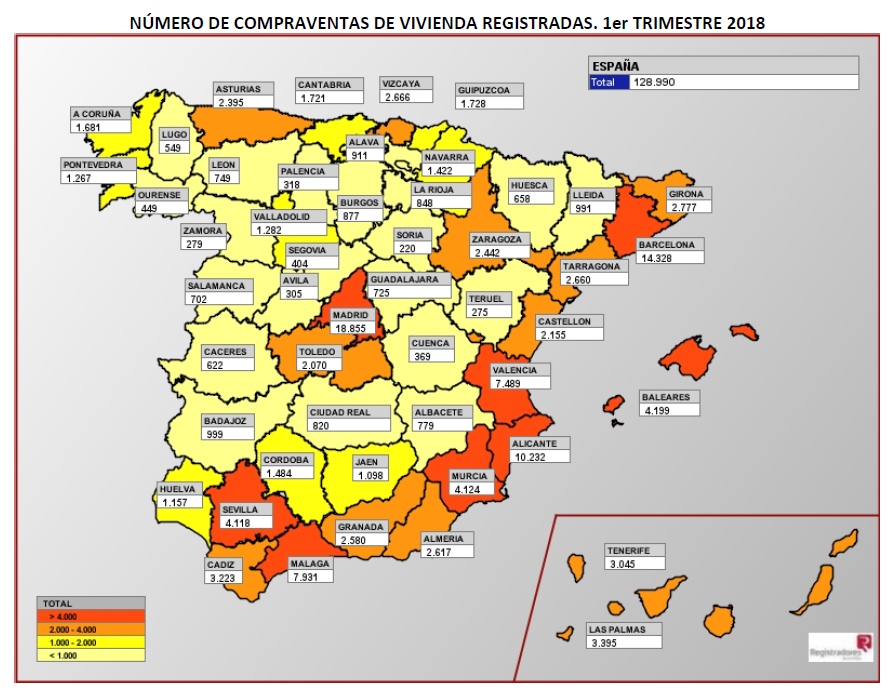
Remember, this data is for the whole of Spain. The table and map below shows the breakdown by region, where you can see the Andalucia region continues with intense activity, being the region with the highest number of properties sold in 2018:
Property transactions grouped by autonomous region – Year 2018
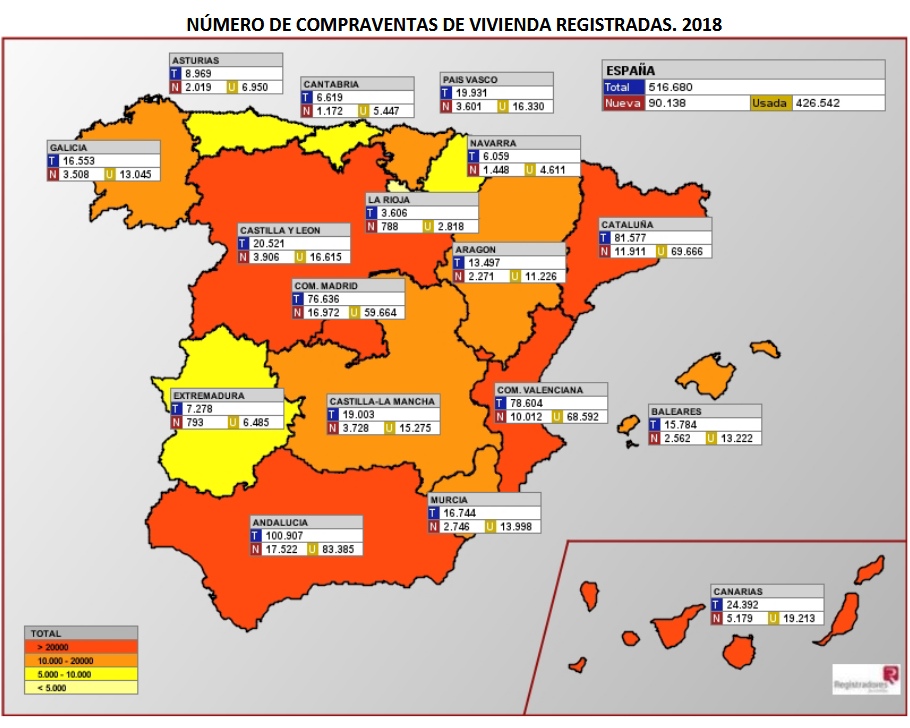
Worthy of note is the fact that 17% of the sales are for newly constructed properties (first occupancy). This has been approximately steady between 17-18% throughout the year 2018.
In coclusion, we would like to see this trend continuing positively. The cooler pace is a welcome development as it would mean a more sustainable market environment, the interest rates remain low, and the increase in January 2019 activity bodes well for the first trimester of 2019.
Thanks for reading and please contact us if you have any questions, or visit our Costa del Sol properties website for more statistics: hbcostadelsolproperties.com
For a podcast version of this article please download this MP3 file: https://hbcostadelsolproperties.com/hbcmarketreport.mp3
 0
Like
Published at 4:05 PM Comments (0)
0
Like
Published at 4:05 PM Comments (0)
Property market analysis for the Costa del Sol - January 2019
Sunday, January 13, 2019
Properties in Spain are increasingly popular compared to last year, with prices still rising despite Brexit upheaval.
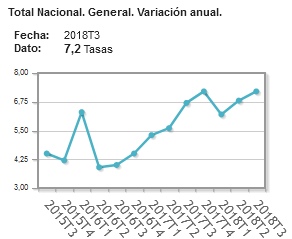
Property sale data for November 2018 and price data for the 3rd quarter of 2018 have been published by INE, the Spanish statistics institute. The annual variation of the price index (i.e. compared to the 3rd trimester of 2017) is 7.2%:
Broken down by type, newly constructed properties have risen by 6.1% in price and resale properties by 7.3% annually.
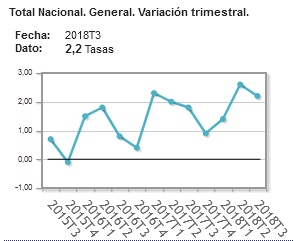
When compared to the previous quarter, we see the upward sloping trend pulling back in absolute magnitude, but still positively increasing by 2.2% compared to 3rd trimester of 2017:
The table below summarises the data:
|
|
|
Quarterly variation
|
Annual variation
|
|
Average index
|
|
2.2
|
7.2
|
|
New construction
|
|
2.0
|
6.1
|
|
Resale properties
|
|
2.2
|
7.3
|
As always, we look for confirmation of these price increases by comparing the number of total sale operations - if it also increased year-on-year it reassures us by implying a broad market advance. If there were less sales overall, then this might indicate that the market is pausing and that the higher price average is temporary. The total purchase operations for November 2018 were 170,271, a 9.4% annual increase from November 2017. A healthy increase that justifies the opening line of this article!
Remember, this data is for the whole of Spain. The table below shows the breakdown by region, where you can see the Andalucia region has had intense activity:
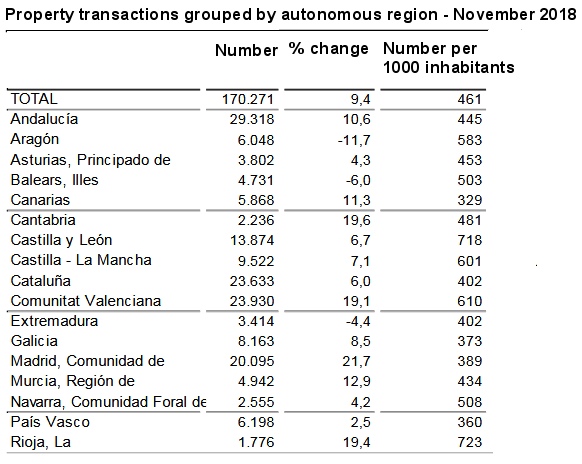
An increase of 10.6% from November 2017, which is healthy. However, the accumulated yearly sales in Andalucia are tallying up a -5.9% decrease upto the end of Novemver 2018. We will keenly await the next batch of data to observe if this figure has gotten more negative (i.e. a more serious market slowdown), or less negative which would indicatethat the slowdown was temporary, possibly because of the reasons I mentioned in the last article, i.e. slight increase in interest rates etc.. For more data visit www.ine.es
In coclusion, we would like to see this trend continuing positively. The cooler pace is a welcome development as it would mean a more sustainable recovery and obviate the need for raising interest rates.
Thanks for reading and please contact us if you have any questions, or visit our Costa del Sol properties website for more statistics: hbcostadelsolproperties.com
0
Like
Published at 12:51 PM Comments (0)
Property market analysis on the Costa del Sol - November 2018
Saturday, November 17, 2018
Real estate in Spain continues to be popular at a steady pace.
Property sale data for September 2018 and price data for the 2nd quarter of 2018 have been published by INE, the Spanish statistics institute. The annual variation of the price index (i.e. compared to the 2nd trimester of 2017) is 6.8%:
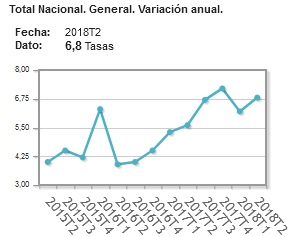
Broken down by type, newly constructed properties have risen by 5.7% in price and resale properties by 7.0% annually.
When compared to the previous quarter, we also see the upward sloping trend continuing:
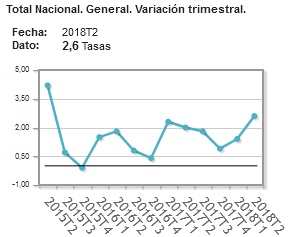
A positive trend for the last trimester, with a slight tendency to increase “speed”. The table below summarises the data:
|
|
|
Quarterly variation
|
Annual variation
|
|
Average index
|
|
2.6
|
6.8
|
|
New construction
|
|
2.6
|
5.7
|
|
Resale properties
|
|
2.6
|
7.0
|
Importantly, these price increases took place alongside an increased number of total sale operations, which is reassuring since it implies a broad market advance. The total purchase operations for September 2018 were 147,377, a 7.7% annual increase from 2017:
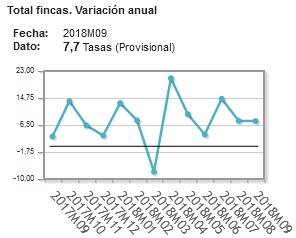
This is a welcome reduction from the frenetic increase of April 2018 of 20%, which implies sales are still growing but at a more sustainable pace. The slight increase of interest rates might explain this cooling down.
Remember, this data is for the whole of Spain. The table below shows the breakdown by region, where you can see the Andalucia region has had intense activity:
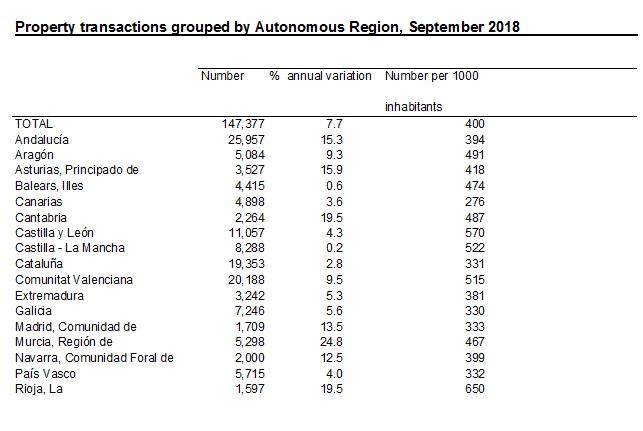
Worthy of note is the fact that 18.7% of the sales are for newly constructed properties (first occupancy). This has been approximately steady throughout the year 2018.
In coclusion, we would like to see this trend continuing positively. The cooler pace is a welcome development as it would mean a more sustainable recovery and obviate the need for raising interest rates.
Thanks for reading and please contact us if you have any questions, or visit our Costa del Sol properties website for more statistics: hbcostadelsolproperties.com
0
Like
Published at 12:48 PM Comments (0)
Should I raise or should I lower my property's price?!
Monday, November 12, 2018
As mentioned in a previous post, one of the datapoints I look out for when it comes to the Spanish real estate market, is price change requests by property owners. Clearly, in an upward trending market sellers would be more likely to raise their asking price after a few viewing appointments, so this provides us with an early signal of possible market turns: if sellers are not daring to raise their asking price, then price reductions might be round the corner.
I will compare the data of the previous article ( https://www.eyeonspain.com/blogs/spainstatistics/17316/to-sell-your-costa-del-sol-property-raise-its-price.aspx ) with year 2018 data, and elaborate a bit more on the time a property spends on the market.
(the data is from a sample I have access to, not the totals of property sales on the Costa del Sol. It is however quite widespread geographically so I believe it is fairly representative)
1. How many decreased vs. how many increased
| Properties sold at a price lower than the initial |
1445 |
| Properties sold at a price equal to the initial (changed, then changed back) |
40 |
| Properties sold at a price higher than the initial |
435 |
| Properties sold without a price change |
4538 |
An impressive 22% of the price-changed properties sold at a higher price than their initial one. This is lower than in 2017, however still an indicator of a highly optimistic environment. Some of those price-increased properties were on the market for less than a month, for example in Estepona or Nueva Andalucia - the longest waiting periods were in Benalmadena, Benahavis, and Casares Playa. 60% of all properties examined were sold within less than a year. The hottest areas in that respect were Fuengirola, Calahonda and Malaga city, where around 80% of the properties were sold in less than a year.
2. The maximum amount of a price upward change
The highest upward price change was for a villa in El Rosario, by 310,000 euros, a 20% increase for that particular property. Again, some cooling down from 2017, which in my opinion indicates a healthier, non-bubbly market, while still on a positive trend. The highest average asking price increase was for townhouses for sale in Mijas, where 50% of the properties had their prices raised 27% on average and still were sold.
3. Similar time on the market
Of special interest to us this time, was drilling down to individual areas to see which were the most likely to "allow" an increase in asking price, while still being sold within a reasonable time. First the data:
| Location |
Min days to sell |
%age sold in less than a year |
| La Mairena |
62 |
100 |
| Malaga Centro |
13 |
80 |
| La Duquesa |
46 |
71 |
| Elviria |
15 |
67 |
| Fuengirola |
27 |
67 |
| Riviera del Sol |
21 |
63 |
| Mijas Costa |
27 |
58 |
| Benalmadena |
70 |
47 |
| Miraflores |
21 |
40 |
| Benalmadena Pueblo |
69 |
40 |
| The Golden Mile |
12 |
38 |
| Nueva Andalucía |
31 |
33 |
| Selwo |
55 |
33 |
| Estepona |
37 |
29 |
| Casares |
53 |
25 |
| Guadalmina Alta |
63 |
20 |
Let's take the example of Fuengirola: of the properties whose owners realised they could demand more, 67% were still able to sell it within a year, and in some cases as early as 27 days! If you live in any of the above top competitive areas, consider revising your asking price!
As always, my disclaimer: the data sample is not encompasing the whole of the Costa, even though it is quite a varied sample. And I am presenting here data averages - individual properties will of course warrant individual prices. However, I hope this has been useful in giving you an idea of the current state of seller confidence in the property market on the Costa del Sol.
Thanks for reading, any questions below I will try to answer as soon as I can.
0
Like
Published at 10:01 PM Comments (0)
Property market analysis on the Costa del Sol - June 2018
Friday, June 15, 2018
The last 12 months have been extremely positive for Spanish properties nationwide.
The data for the 1st quarter of 2018 have been published by INE, the Spanish statistics institute. The annual variation of the price index (i.e. compared to the 1st trimester of 2017) is 6.2%:
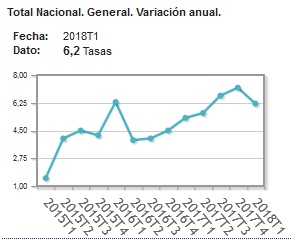
Broken down by type, newly constructed properties have risen by 5.7% in price and resale properties by 6.3% annually.
When compared to the previous quarter, we also see an average upward sloping trend:
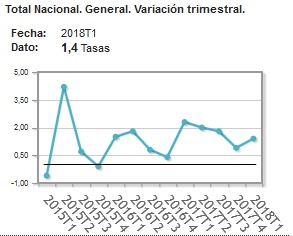
A positive trend for the last trimester, at a slight tendency to increase “speed”. The table below summarises the data:
|
|
|
Quarterly variation
|
Annual variation
|
|
Average index
|
|
1.4
|
6.2
|
|
New construction
|
|
2.1
|
5.7
|
|
Resale properties
|
|
1.3
|
6.3
|
These price increases took place based on an increased number of total sale operations, which is reassuring since it implies a broad market advance. The total purchase operations for April 2018 were 161,444, a 20.8% annual increase from 2017:
The distribution of buyers by nationality was: British (14.59%), German (7.85%), French (7.64%), Belgian (6.83%), Swedish (6.57%), Italian (5.77%)
Remember, this is for the whole of Spain. The map below shows the breakdown by community, where you can see the Malaga province (mainly Costa del Sol) has had intense activity:
Prices are increasing at a faster rate than in previous trimesters. Also, the leaders of this increase are not anymore the northern provinces and big cities (apart from the 2 ever present Madrid and Barcelona), which suggests that foreign buyers are probably fueling this activity, contributing 13.11% of total purchases in Spain and an extravagant 30.57% in Malaga province. Despite uncertainties from Brexit, it seems that the European nationalities mentioned above are feeling confident.
In coclusion, we would like to see this trend continuing positively, albeit perhaps at a cooler pace. This would mean a more sustainable recovery. At per the latest ttrimester, it seems that the prices are increasing at a slightly slower pace – we would expect perhaps another trimester of cooler increases (the traditionally quieter summer months), before a resumption of the previous percentage increases.
Thanks for reading and please contact us if you have any questions, or visit our Costa del Sol properties website for more statistics: hbcostadelsolproperties.com
2
Like
Published at 6:44 PM Comments (0)
Which areas of the Costa del Sol have seen a REAL rise in property prices?
Saturday, December 2, 2017
The rise in property prices in the last 2-3 years has been showing in the government statistics and, while not anything to write home about, it has been a fact confirmed by numbers. As you know, this blogger likes cold hard number analysis before any conclusions, so I got to the task to examine at the area level whether properties prices have really risen on the Costa del Sol.
My favourite metric for prices is the Euros per metre squared (EUR/m2) that removes as much noise as possible from price data. It is the equivalent of comparing apples to apples, since no property is alike any other, therefore if we group properties at the area level we can at least assume that any other factors that affect price are very similar, and the main factor affecting price is the square metreage.
With the assumptions out of the way, let's look at the data. I have looked at the period since my last article relating to this: https://www.eyeonspain.com/blogs/spainstatistics/17172/fair-price-for-property-on-the-costa-del-sol---a-basic-reference.aspx i.e.for the last 6 months. I have been recording the average cost of EUR/m2 for each area for each week since then - and looked at the minimum and maximum values for that period. In other words, I was looking to see if these average EUR/m2 have moved up or down since then.
Result 1: Out of 147 areas of the Costa del Sol, 75 have had their minimum EUR/m2 rise. I.e. the minimum price owners will sell their property for has risen in half of the areas. This in itself does not mean a lot, 50-50 is to be expected.
Result 2: However I counted 39 areas that have had both their minimum and maximum EUR/m2 go up, i.e. the property owners are not only unwilling to accept a low price, but are also raising their selling prices at the higher end. In one word this is called "Optimism", a very crucial element in any healthy market. Below I display the list of areas that have had property rises confirmed by statistical data (admittedly not the government's but our own anecdotal data):
| Location |
% change of lowest EUR/m2 |
% change of highest EUR/m2 |
| Alhaurin el Grande |
31 |
20 |
| Arroyo de la Miel |
46 |
11 |
| Artola |
9 |
8 |
| Bahia de Marbella |
2 |
2 |
| Bajondillo |
29 |
29 |
| Benamara |
18 |
32 |
| Calypso |
14 |
2 |
| Campillos |
1 |
1 |
| Campo Mijas |
107 |
16 |
| Carib Playa |
1 |
3 |
| Cortijo Blanco |
33 |
10 |
| Costabella |
26 |
1 |
| Costalita |
51 |
9 |
| Cruz Humilladero |
17 |
16 |
| El Faro |
5 |
16 |
| El Pinillo |
1 |
4 |
| Elviria |
4 |
7 |
| Fuengirola |
5 |
10 |
| Guadalmina Alta |
18 |
52 |
| Guadalmina Baja |
2 |
1 |
| La Carihuela |
10 |
5 |
| Las Brisas |
2 |
3 |
| Los Pacos |
20 |
25 |
| Malaga |
30 |
16 |
| Malaga Centro |
5 |
34 |
| Malaga Este |
7 |
12 |
| Manilva |
14 |
3 |
| Miraflores |
5 |
0 |
| Montemar |
71 |
3 |
| Nueva Andalucia |
6 |
58 |
| Puerto Banus |
3 |
1 |
| Reserva de Marbella |
7 |
1 |
| Riviera del Sol |
13 |
40 |
| San Luis de Sabinillas |
35 |
2 |
| San Pedro de Alcantara |
25 |
7 |
| Selwo |
6 |
7 |
| Torremolinos |
2 |
110 |
| Torremolinos Centro |
5 |
6 |
| Torremuelle |
17 |
1 |
I hope you are an owner in one of the above areas, perhaps you could confirm or dispute the findings based on your own experience in the comments below.
If I had to draw a generic conclusion from the data, it would be that the longer established areas have not seen as much of a rise (perhaps where British people have traditionally lives, for example properties in Calahonda - Brexit effect? ), but peripheral areas like Nueva Andalucia, Campo Mijas, San Pedro etc have had most of the benefit.
Something to watch for in 6 months. If the trend continues perhaps we will see clients expanding their horizons even further to inland and more westerly/easterly Costa del Sol areas.
Thanks for reading, and have a good weekend.
0
Like
Published at 1:48 PM Comments (0)
New construction is a favourite in Andalucia
Monday, September 18, 2017
One of the anecdotal conversations currently taking place in the real estate world, is the pace of new construction on the Costa del Sol. It's easy enough to observe that over the last 1 year many cranes have popped up behind every corner - but I like statistics as you know, so I went on a search to verify.
One of my favourite websites to lurk around is INE.es, Spain's statistical office. It offers us the following succinct data table for the whole of Spain, which shows the year period (first column), the total number of housing starts (second column), and number of residential housing starts (third column).
| 2016 |
23,977 |
19,801 |
| 2015 |
21,223 |
17,052 |
| 2014 |
16,573 |
13,003 |
| 2013 |
16,676 |
12,868 |
| 2012 |
20,758 |
16,242 |
You can see the increase in both residential and business construction starts, especially since 2015. The year 2017 so far has advanced as follows:
| May |
2,624 |
2,163 |
| Abr |
2,004 |
1,638 |
| Mar |
2,770 |
2,320 |
| Feb |
2,265 |
1,912 |
| Ene |
2,141 |
1,795 |
Almost 10,000 project units till May, which means we are heading for matching 2016 and more. Now, this data is for the whole of the country, how does Andalucia fare?
| Year 2016 |
Year 2017 |
| (trimester) |
(trimester) |
| 1º |
2º |
3º |
4º |
1º |
| 1,589 |
1,672 |
1,409 |
1,645 |
1,399 |
The data only goes to April 2017, but it shows that around 25% of the new Spanish construction was in Andalucia! Coupled with the 2.6% increase in prices for new construction residential units in the 2nd trimester) ( see: http://www.ine.es/dyngs/INEbase/es/operacion.htm?c=Estadistica_C&cid=1254736152838&menu=ultiDatos&idp=1254735576757 ) it all points to a rather frenetic pace in new developments on the Costa del Sol.
I finish with an informal piece of information, you should not take my work for it but there it is anyway: at HBC we were trying to get an agreement with one of the luxury developments we were interested in. The developer said: Phase 1 is sold out (they haven't even started it), and for Phase 2 I have too many estate agents with agreements already. We did manage to strike the deal, but it appears that there is strong demand from Europe for new construction, rather than resales.
But that is a subject for another post :-) Enjoy your day, thanks for reading.
0
Like
Published at 8:36 PM Comments (0)
Spanish property prices grinding higher - latest data
Saturday, September 9, 2017
I hope everyone had a nice summer and are back relaxed and ready for more number crunching and thrilling statistics on Spanish property!
Before you read on, spoiler alert: the prices of Spanish properties are continuing to rise. Not at an overheated pace, but a steady grind upwards.
The data for the 2nd quarter of 2017 have just been published 2 days ago by INE, the Spanish statistics institute. The annual variation of the price index (i.e. compared to the 2nd trimester of 2016) is 5.6%:
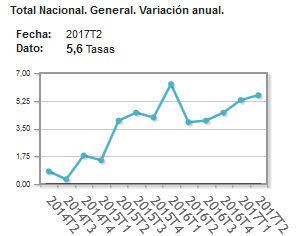
Broken down by type, newly constructed properties have risen by 4.4% and resale properties by 5.8% annually.
When compared to the previous quarter, we also see an average upward sloping trend:
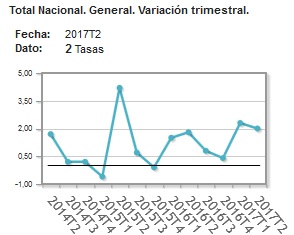
This set of data is easy to analyse, since it's in the same trend as before, bringing us to prices around 10% higher than the level of 2015. The table below summarises the data:
| |
|
Quarterly variation |
Annual variation |
| Average index |
|
2,0 |
5,6 |
| New construction |
|
2,6 |
4,4 |
| Resale properties |
|
1,9 |
5,8 |
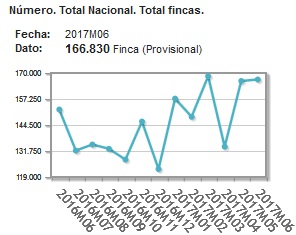
These price increases took place based on an increased number of total sale operations, which is reassuring since it implies a broad market advance. The total purchase operations for June 2017 were 166,830, a 9.7% annual increase:
Remember, this is for the whole of Spain. What was more interesting in this data publication was that Andalucia is no longer the leader in percentage price increases. Here is the breakdown by community:
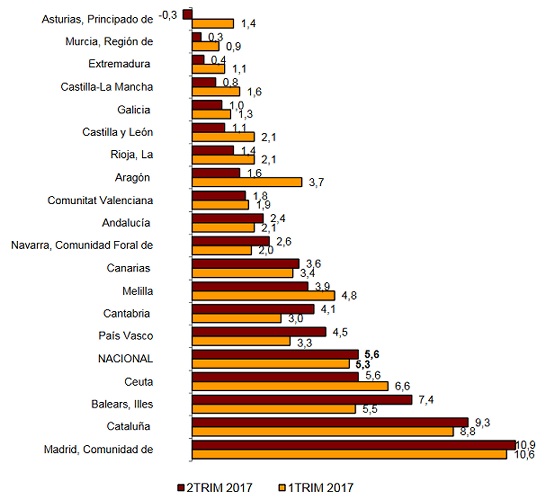
Here comes my personal evaluation of this latest data: I am pleased to see a broad participation in the property market in Spain. The leaders are the capital cities and other northern areas of Spain that have traditionally not been the most popular with foreign buyers. This implies that the local Spanish buyers themselves are fuelling this advance, which to my mind is an indication of a healthy and strengthening economy, where people are feeling more confident.
In coclusion, I would like to see this trend continuing where the Spanish property price index keeps adding on a 2.4% increase in Andalucia and Costa del Sol, rather than a frenetic pace that might lead to imbalances. I will be watching the next set of data after Autumn, which is normally a quiet period for purchases in the south, for more evidence of a broad Spanish market recovery, spread over many areas.
Thanks for reading and, as always, please leave a comment if you have any questions, or visit our Costa del Sol properties website for more statistics: hbcostadelsolproperties.com
1
Like
Published at 7:25 PM Comments (2)
To sell your Costa del Sol property ... raise its price!
Monday, May 22, 2017
In a previous article I have mentioned that many properties on the Costa del Sol have had their prices raised after a certain period in the market. I wondered what the price path was for properties which actually got sold - it's one thing to raise the asking price of a property but another to sell it at that.
My data sample involves 590 properties that had at least 1 price change through their life on the market, and which then went on to get sold in 2016/17 for that last price point. Not a massive data sample but it spans a wide range of locations, it comes from various agents, and it covers all property types. I was not expecting this:
1. How many decreased vs. how many increased
| Properties sold at a price lower than the initial |
436 |
| Properties sold at a price equal to the initial (changed, then changed back) |
24 |
| Properties sold at a price higher than the initial |
129 |
A whole 33% of the properties sold at a higher price than their initial one! Half of those properties were on the market for less than 300 days - not an unreasonable amount of time to wait for a sale. The midpoint house/apartment/villa was on the market for 251 days.
2. The maximum amount of a price upward change
The top 3 upward price changes were for villas in Nueva Andalucia where the maximum upward price revision was ... 510,000 euros, a 30% increase for that particular property. Of course Nueva Andalucia has some very desirable properties but it is striking that 9.6% of the upwardly-revised properties (not only villas) were located there. Next best locations were Guadalmina and Fuengirola.
3. Similar time on the market
Of course there were also some extremes, for example an apartment in Calahonda had taken 1660 days to sell. However approximately 250 days is what it took for both sets of properties to sell. Which probably means that sellers are not necessarily too desperate to sell, otherwise we would have seen really short periods on the market for properties that were reduced in price, indicating pressure to sell.
My conclusions: despite my average-sized data sample (unfortunately I can only work with the sales price data I have access to), it seems that the desire to get more money for a property is strong. Sellers are willing to change their price upwards and still they manage to only wait a similar amount of time for a sale as the more keen sellers.Long may this optimism last! :-)
0
Like
Published at 11:13 PM Comments (0)
Getting technical: Median and Average property prices, up or down?
Friday, May 5, 2017
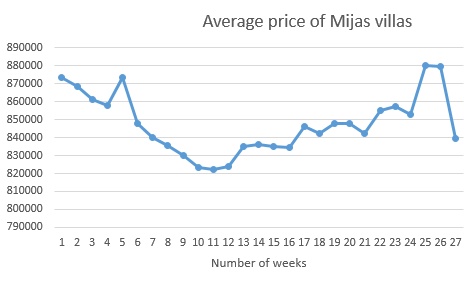
The property portal idealista has released some unofficial data for April Spain property prices that show a decrease of 1.3% compared to last year, even though they have increased over the previous month. The official INE organisation has not released its own data yet, but the Costa del Sol is expected to have an increase in general. However, a little data checking never hurt anyone  So I have taken our own property data collected every week, and used Mijas villas as a working example because the effect of what I want to show is more pronounced. So I have taken our own property data collected every week, and used Mijas villas as a working example because the effect of what I want to show is more pronounced.
It is true that there was a sharp drop of the average price of Mijas villas during the last couple of weeks:
Looking at the number of villas on the market for the same location we see there was a corresponding sharp increase:
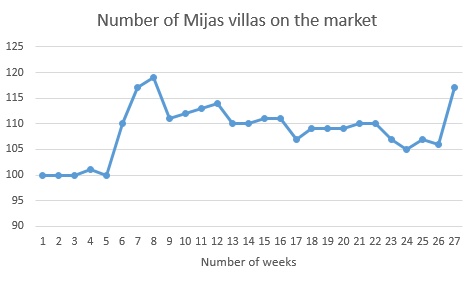
So it appears possible that what I mentioned some weeks ago might be happening again - namely, that as owners see rising prices, more and more of them are willing to offer their villa in Mijas for sale. But the average price should not be dropping so much, other things being equal - the point of having an average is that it shouldn't matter how many properties are on the market, the price gets "averaged" out. So I looked at each individual villa price in detail to understand what is happening:
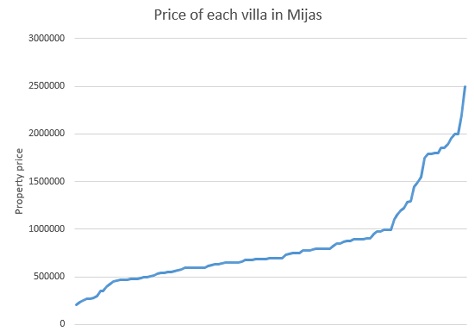
Each data point in the graph above shows the price of that individual villa. As you can see around 80% of the properties are between 400,000 and 1 million euros, and the other 20% are covering a much larger range of 1 m - 2.5 m euros. Could it be that the higher priced properties are being sold fast and therefore the whole "total amount" of euros in the market is dropping? That would explain the average price drop since it is simply the division of (total euro value of properties in the market) / (number of properties).
I cannot offer confidential data but indeed there were a few large amount sales in April of villas in the Mijas area (1.65 m on the 28th, 2.25 m on the 16th, etc) that have therefore brought the average price down, since there are more of the "lower priced" villas left in the calculation. This data is collected from a large agent sample, so even though it is not official, it is quite reliable.
A more accurate indicator is the median property price - I apologise for sounding like a teacher, it is not my intention, just to explain that median is the price of the middle property, i.e. in the graph above half way along the x-axis. For Mijas villas this gives us 695,000 euros for the median villa in Mijas, a level that has been stable for months and even increased slightly (0.1%) over the last month. I.e. if anything this confirms that average prices have wild fluctuations sometimes, even in cases such as these which could be perceived as good news, since higher priced property being sold shows confidence in the market.
In conclusion, I would state that I am guilty of being ever the optimist, including on this occasion where a declining average price actually is due to proportionately more high-valued properties being sold, which might indicate more confident buyers. If you are interested in browsing at the villas in Mijas that I used for this article I leave the link here: https://hbcostadelsolproperties.com/costadelsol/mijas/villa. Thanks for reading.
1
Like
Published at 8:36 PM Comments (3)
Spam post or Abuse? Please let us know
|
|